
- sharksightings.csv: This file contains reported white shark sightings between September 8, 2012, and February 22, 2013. Includes beach site, date, time and location.
- sharkspotter-beaches.csv: This file contains the beach locations where Shark Spotters are stationed, whether it’s a permanent or temporary Shark Spotter location, and a short description.
- Log in to your
- Go to Google My Maps: https://www.google.com/maps/d/
- select Create a new map:

- Click the text Untitled map to edit the map title and description. In this case, we’ve supplied some text below for you to copy and paste into the Map title dialog box:
Shark Spotter Sites & Sightings - Now copy and paste the text below into the Description dialog box:
This map shows the location of Shark Spotters along the False Bay coastline in South Africa, as well as all reported white shark sightings between September 8, 2012, and February 22, 2013. Shark Spotters are positioned at strategic points along the Cape Peninsula. A spotter is placed on the mountain with polarised sunglasses and binoculars. This spotter is in radio contact with another spotter on the beach. If a shark is seen along the beach, the spotter sounds a siren and raises a specific color-coded flag, upon which swimmers are requested to leave the water. - In the menu, select Import:

- Select the sharksightings.csv from your desktop. This will be the first data layer we upload.Tip: You can also import a XLSX file or a Google Sheet. You may upload a table containing up to 2,000 rows
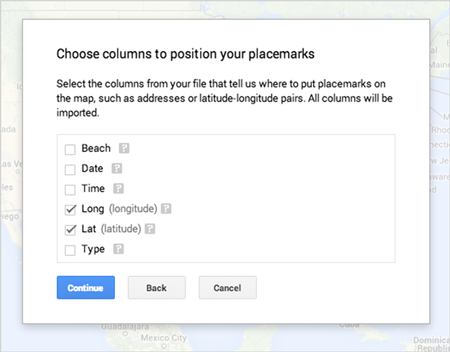
- After uploading your data, you’ll be asked to select the column(s) with location information, so that your data will be correctly placed on the map (e.g. columns with latitude and longitude information). For this example, select the Lat and Long columns, and hit Continue. You can hover over the question marks to see sample data from that column.Tip: If you don’t have latitude and longitude information, you can use addresses in your columns instead.
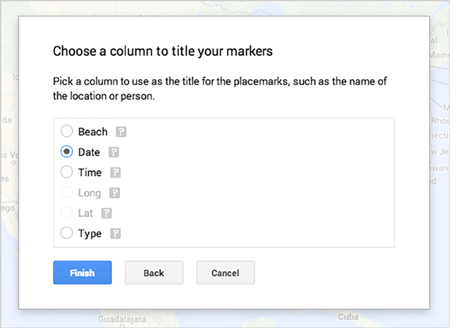
- Now pick the column you’d like to use to title your markers. For this example, select the Date column and hit Finish:
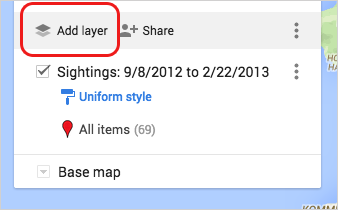
- You should now see your data as a layer in the menu, and your points plotted on the map. If you’d like to change the name of this layer in the menu, just select the text of the layer name (the default will be the file name). For this example, change the layer name to Sightings: 9/8/2012 to 2/22/2013.

- Now let’s upload the second data layer. Click Add layer.
 Repeat steps 6 through 9 using the sharkspotter-beaches.csv from your desktop. Select the Lat and Longcolumns for your location column, and select the Beach Name column to title your markers.
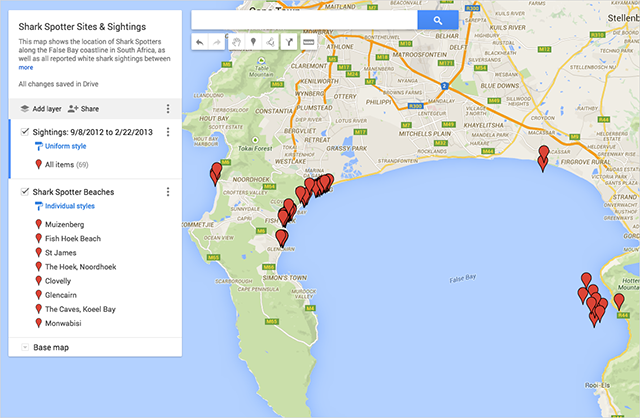
 - You should now see both layers visible in your menu and plotted on your map. Select the text of the layer title, and change the name to Shark Spotter Beaches.

Summary
1- Import your data to Google My Maps
2- Style your map on Google My Maps
3- Change the style of your base map on Google My Maps
4- Edit your map data on Google My Maps
5- Label your data on Google My Maps
6- Share and embed your map from Google My Maps
7- Search and filter your data on Google My Maps
8- Embed your map from Google My Maps